Hi Richard.
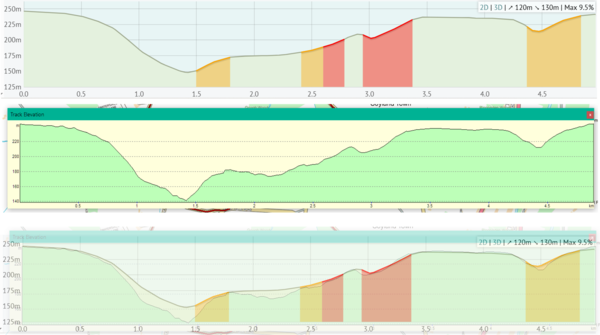
I find the elevation profile display can be a pretty rough approximation to reality at times. I was looking at a hilly little loop which I was going to simulate in Training Peaks Virtual. The loop includes a very steep descent into a dip at Mill Bank and a very steep climb out of the dip. Your elevation display smoothed all the difficulty out of it, claiming the maximum gradient to be 9.5% whereas in reality it is closer to double that! I would have been really caught out if I had chosen that road expecting less than 10% gradients.
This is the loop in question: https://cycle.travel/map/journey/894967
I have drawn the same loop in my old Memory Map software which uses OS mapping. The profile that came up with is much more like the real thing. The picture below shows the 2 profiles separately and then overlaid to make the difference obvious.
I have also noticed that your maximum gradient figure is often less than the figure that the software displays on the profile itself. Example below...
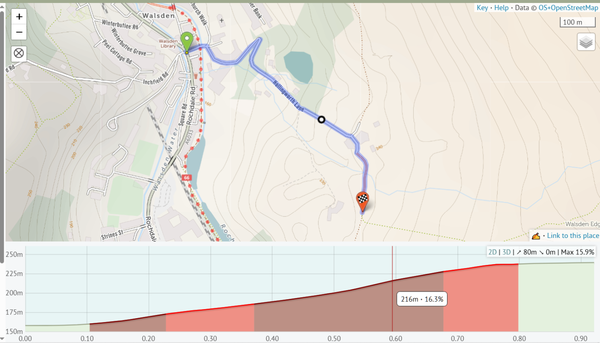
Max 15.9% but 16.1% shown on the climb itself! That is only a small difference but I have seen the max being displayed as being 5+% less than reality.
Do you think that you could improve the accuracy of the gradient figures and the elevation profiles?