
Become a supporter
A route which I will use for a CycleChat forum ride in August, 2026 (and probably again in years to come). It starts and finishes at Spring Wood picnic centre, Whalley. The outward leg to Glasson Dock has the bulk of the climbing, including the Trough of Bowland and Jubilee Tower climbs. We will stop at a cafe at Glasson Dock at around the halfway point. The return leg is less demanding, but is still pretty undulating. Total distance 103 km. I will double check the amount of ascent... Cycle.travel reckons around 1,200 m but it could be a little more?
A metric century route that I planned for CycleChat forum rides. It is very flat and so ideal for singlespeed/fixed gear bikes.
Another scenic loop from Lytham St Annes. Flat start and finish, hilly in the middle. Be careful on the descent off Waddington Fell - there are sometimes sheep wandering across the road. I also got caught out on one bend by going in too hot!
A nice loop from the flatlands to the lovely Trough of Bowland and back. Easy start and finish, and lumpy in the middle.
Hi Richard.
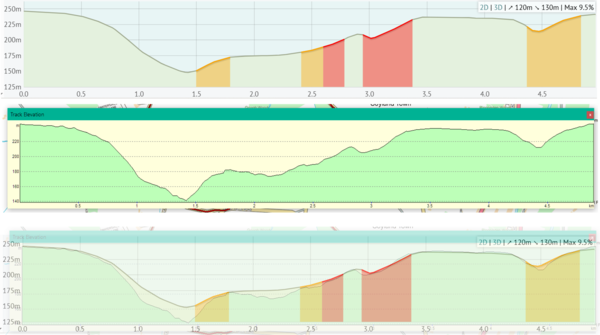
I find the elevation profile display can be a pretty rough approximation to reality at times. I was looking at a hilly little loop which I was going to simulate in Training Peaks Virtual. The loop includes a very steep descent into a dip at Mill Bank and a very steep climb out of the dip. Your elevation display smoothed all the difficulty out of it, claiming the maximum gradient to be 9.5% whereas in reality it is closer to double that! I would have been really caught out if I had chosen that road expecting less than 10% gradients.
This is the loop in question: https://cycle.travel/map/journey/894967
I have drawn the same loop in my old Memory Map software which uses OS mapping. The profile that came up with is much more like the real thing. The picture below shows the 2 profiles separately and then overlaid to make the difference obvious.
I have also noticed that your maximum gradient figure is often less than the figure that the software displays on the profile itself. Example below...
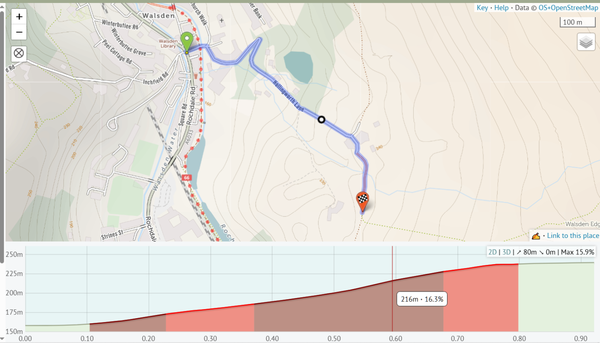
Max 15.9% but 16.1% shown on the climb itself! That is only a small difference but I have seen the max being displayed as being 5+% less than reality.
Do you think that you could improve the accuracy of the gradient figures and the elevation profiles?


Made in the Cotswolds. Published by Éditions Système D Ltd.
Log in with your cycle.travel account:
| Password |
Or simply use your account on:
