
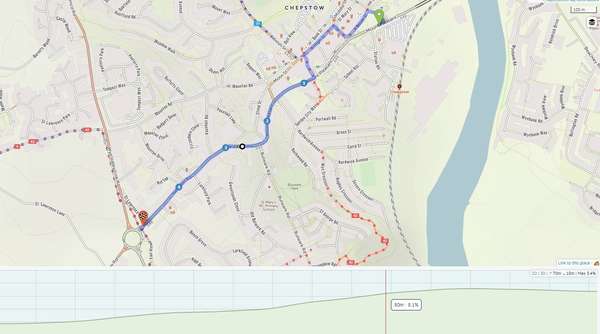
Here's an example screenshot. The maximum gradient is showing as 3.4%, whereas the local gradient under my cursor is showing as 8.1%.
Where does the 3.4% figure come from?

Become a supporter
cycle.travel now has Ordnance Survey maps
Plan multi-day adventures easily
Thanks to Swaledale Outdoor Club!
We’re now in Australia and New Zealand too
Stick to tarmac with our new routing option
cycle.travel expands to Scandinavia and Eastern Europe
Smart Turns – new on cycle.travel's route-planner
Here's an example screenshot. The maximum gradient is showing as 3.4%, whereas the local gradient under my cursor is showing as 8.1%.
Where does the 3.4% figure come from?


Made in the Cotswolds. Published by Éditions Système D Ltd.
Log in with your cycle.travel account:
| Password |
Or simply use your account on:
Comments
Apologies - the screenshot lost resolution in the upload. You'll have to take my word for it :)
I think the best answer is that gradient calculation is remarkably complex and it’s something I’m still working on!
Fair enough! Thought it might have been a bug.
"It's complicated" is a completely valid answer.
Essentially the problem is that raw elevation data for a route is always pretty jagged. If you just total up all the ups and downs from the data, then the total climb ends up being about 50% more than it really is, and the gradients are equally off-whack. So we have to do a fair bit of smoothing, including disregarding the smallest ‘climbs’ which are actually just undulations on the flat… and that isn’t really working to my satisfaction yet. It’s on the list. :)